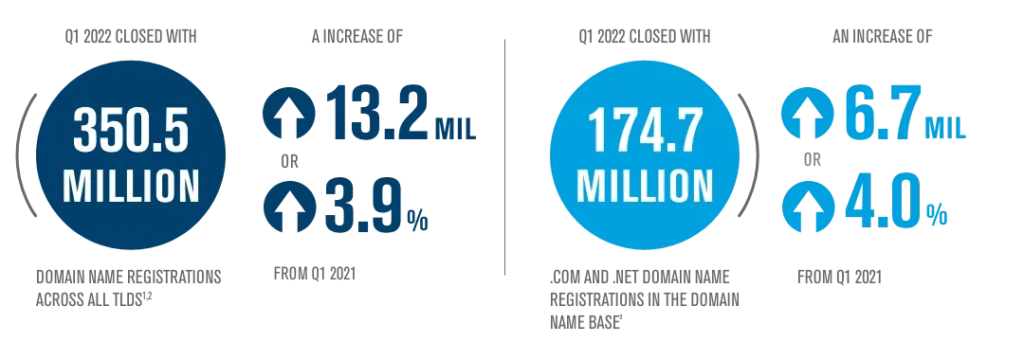
The first quarter of 2022 closed with 350.5 million domain name registrations across all top-level domains, an increase of 8.8 million domain name registrations, or 2.6%, compared to the fourth quarter of 2021. Domain name registrations have increased by 13.2 million, or 3.9%, year over year.
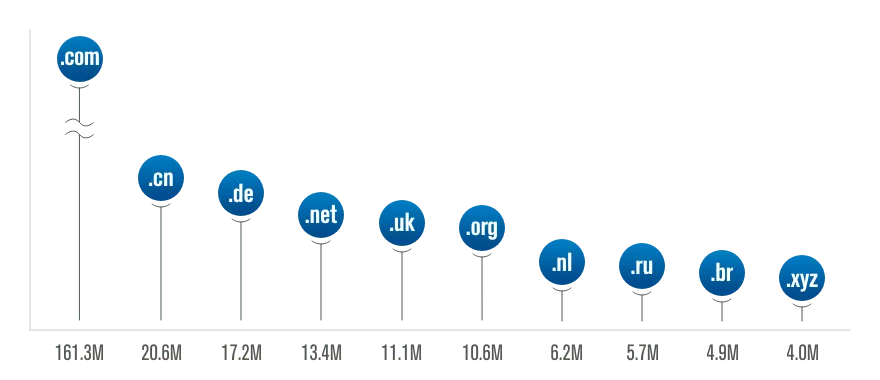
The .com and .net TLDs had a combined total of 174.7 million domain name registrations in the domain name base3 at the end of the first quarter of 2022, an increase of 1.2 million domain name registrations, or 0.7%, compared to the fourth quarter of 2021. The .com and .net TLDs had a combined increase of 6.7 million domain name registrations, or 4.0%, year over year. As of March 31, 2022, the .com domain name base totaled 161.3 million domain name registrations, and the .net domain name base totaled 13.4 million domain name registrations.
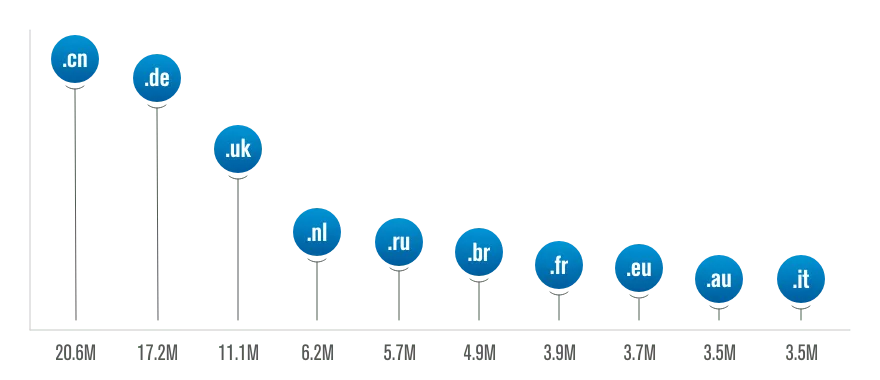
Total country-code TLD domain name registrations were 133.4 million at the end of the first quarter of 2022, an increase of 6.0 million domain name registrations, or 4.7%, compared to the fourth quarter of 2021. ccTLDs increased by 3.1 million domain name registrations, or 2.4%, year-over-year
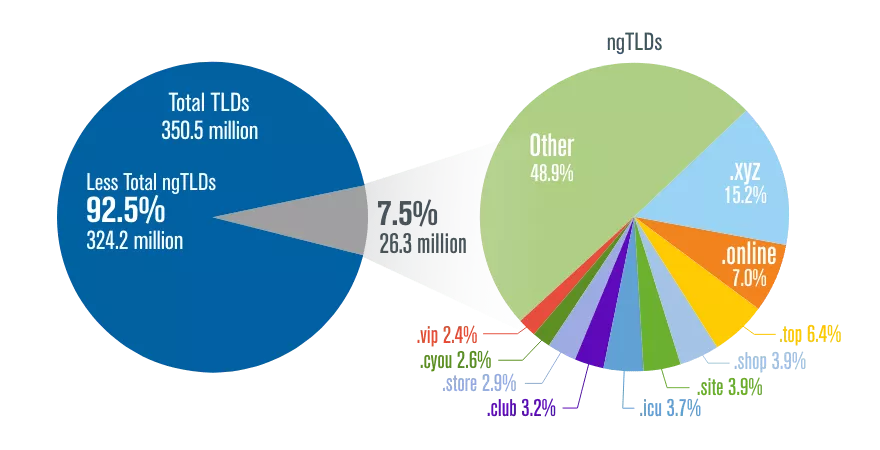
Total new-generic TLD domain name registrations were 26.3 million at the end of the first quarter of 2022, an increase of 1.6 million domain name registrations, or 6.6%, compared to the fourth quarter of 2021. ngTLDs increased by 3.5 million domain name registrations, or 15.3%, year over year.
TOP 10 LARGEST TLDS BY NUMBER OF REPORTED DOMAIN NAMES
TOP 10 LARGEST CCTLDs BY NUMBER OF REPORTED DOMAIN NAMES
ngTLDS AS PERCENTAGE OF TOTAL TLDS
GEOGRAPHICAL ngTLDs AS PERCENTAGE OF TOTAL CORRESPONDING GEOGRAPHICAL TLDs
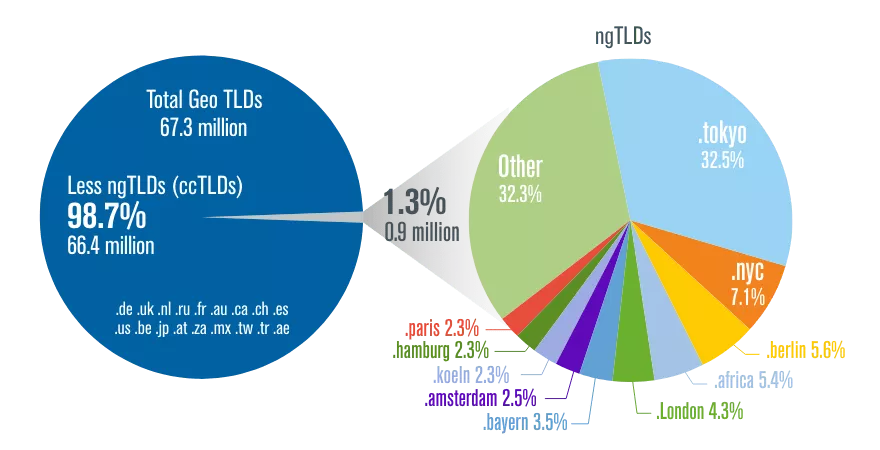
1) had a geographical focus and
2) had more than 1,000 domain name registrations since entering general availability.
The chart on the left summarizes the domain name registrations, for the listed ccTLDs and the corresponding geographical ngTLDs within the same geographic region.
In addition, the chart on the right highlights the top 10 geographical ngTLDs as a percentage of the total geographical TLDs.
METHODOLOGY
The data presented in this brief, including quarter-over-quarter and year-over-year metrics, reflects information available to Verisign at the time of this brief and may incorporate changes and adjustments to previously reported periods based on additional information received since the date of such prior reports, so as to more accurately reflect the growth rate of domain name registrations. In addition, the data available for this brief may not include data for all of the 308 ccTLD extensions that are delegated to the root zone, and includes only the data available at the time of the preparation of this brief. Beginning with Vol 19, Issue 1 of The Domain Name Industry Brief, the .tk, .cf, .ga, .gq and .ml ccTLDs have been excluded from all applicable calculations. The historical data has been adjusted from Vol 19, Issue 1 forward.
For generic TLD and ccTLD data cited with ZookNIC as a source, the ZookNIC analysis uses a comparison of domain name root zone file changes supplemented with other authoritative data sources and independent approximations. For more information, see ZookNIC.com.

